Image credits: Adyen
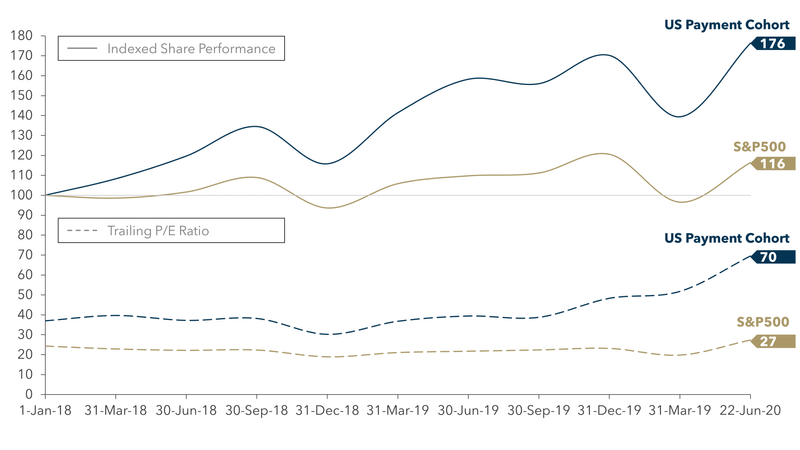
Institutional investors love payments stocks and have driven share prices and valuation levels to record highs despite the pandemic and macro-economic uncertainty. This love affair with payment stocks began (more or less) in 2017 and accelerated in 2018 and 2019, during which time our sample of U.S. payment stocks (1) outperformed with 70% growth in value compared to 21% for the S&P 500 (2).
The onset of COVID-19 as a global pandemic in March was an immediate shock to global equity markets. Payments stocks were not immune to this shock, as our US payments sample decreased 18% in value between 31 December 2019 and 31 March 2020, compared to a 20% decrease of the S&P 500 during the same period. Following the initial shock, payments stocks quickly returned to favor, however. From 1 April through 22 June of this year, our U.S. payments sample grew 26.5% compared to 20.5% for the S&P 500.
FIGURE 1: Performance and Valuation of US Payments Stocks vs. S&P 500

Sources: ycharts, WSJ
Institutional investors are fueling the incredible performance of payment stocks as 86% of our U.S. payments cohort is owned by institutions vs. 66% for FAANG stocks *. These institutional investors love payment stocks due to their resilience (generally not subject to large cyclical swings), cash-flow generation, and growth (fueled by globalization and displacement of cash).
In addition to strong share price performance, institutional investors continue to bet on strong growth as valuation multiples continue to rise. As of 22 June, our U.S. payments sample had a forward P/E ratio of 43*, well exceeding the forward P/E for the S&P 500 of 25*.
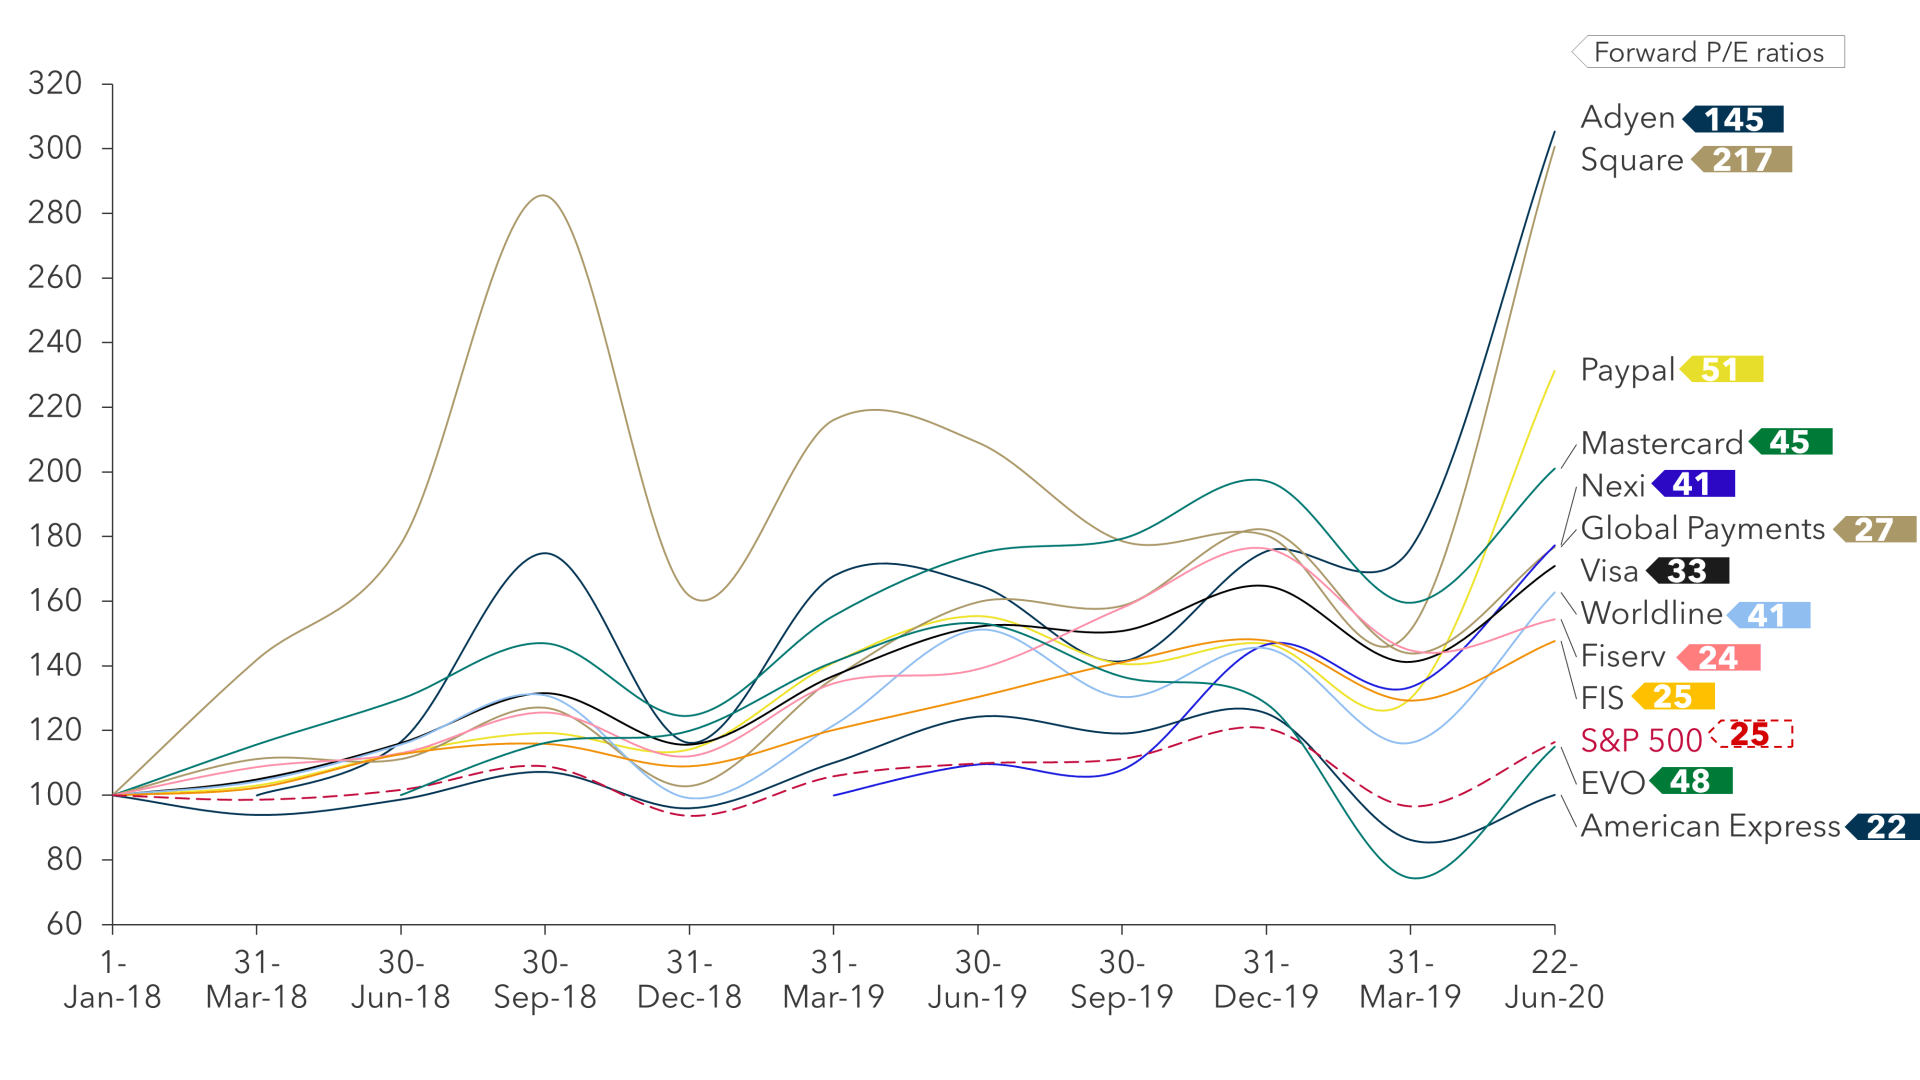
Performance of European payments stocks have been similarly robust, excluding Wirecard. Each of the payment stocks in our small EU sample (3) are up at least 63% since the earlier of inception or 1 Jan 2018 (Worldline up 63%, Nexi 77%, and Adyen 205%)*.
FIGURE 2: Performance and Valuation of Select Payments Stocks (US and EU)

Sources: ycharts, Yahoo Finance
While most payment stocks have strong fundamentals, even during a pandemic, there is significant variation in performance and valuation levels within our public equity sample. American Express, due to its exposure to both travel and credit risk, has trailed S&P 500 performance and is flat relative to 1 Jan 2018. QIWI is also flat relative to 1 Jan 2018 while EVO is generally in line with S&P 500 performance (given its focus on small businesses and greater concentration at the POS). Each of the remaining 15 stocks in our US and EU samples have outperformed the S&P 500.
Valuation multiples range broadly within the sample based primarily on growth. Adyen and Square, which are each achieving topline (gross profit) growth of more than 40% trade at exceptional valuation multiples (Adyen has a forward P/E of 145 and Square 217)*. Larger incumbents achieve organic growth closer to 10% which drives valuation multiples generally in line with the S&P 500.
We will not prognosticate the potential for continued growth and valuation escalation within publicly listed payment equities, but we do expect sector fundamentals to remain generally sound and for institutional investors to continue to focus on the sector for long-term investing. Given this demand and full valuation from institutional investors, we also expect continued IPO activity in the coming years.
Please do not hesitate to contact Joel Van Arsdale at Joel@FlagshipAP.com with comments or questions.
Notes:
* all analysis to the present based on 22 June 2020
(1) Our U.S. payment stock index includes the following U.S. listed companies: Visa, MasterCard, PayPal, FIS, American Express, Fiserv, Global Payments, Square, Fleetcor, WEX, EVO, and QIWI.
(2) S&P 500 share price performance as tracked by the SPY ETF
(3) Eurozone equities in our sample include Adyen, Worldline, and Nexi


