For the last decade, particularly during the pandemic, fintech was synonymous with high growth, oftentimes assigned unobtainable topline growth expectations. In 2022, expectations came crashing back to reality. Gone are false expectations for limitless growth, in are ‘boring’ expectations for profit. We recently examined a sample of 50 publicly listed fintech companies, comparing topline growth (based on gross profit*) and opex growth results between 2021 and 2022. The results suggest a clear dichotomy between mature fintechs and high-growth fintechs. Mature fintechs such as ‘Diversified Processors’ outperform their higher-growth peers on operating leverage, resulting in strong profit performance that generally exceeded expectations in 2022. On the other hand, many high-growth fintechs delivered ’22 opex growth that was badly disconnected from topline growth reality, causing investor disappointment and a now-urgent need to refocus on expense efficiency in 2023.
*Note that we use gross profit rather than gross revenue as many fintech businesses orient around gross profit as the key measure of topline performance.


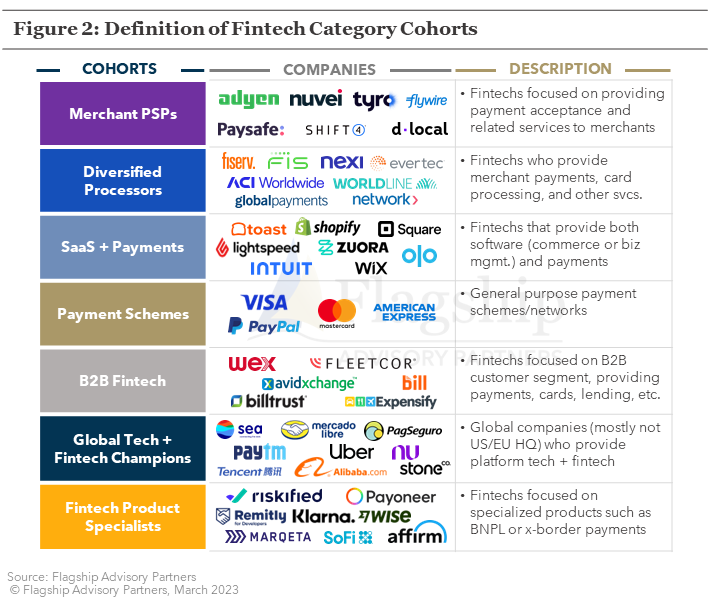
Figure 2 illustrates the categorical definition of our fintech cohorts. Our sample includes 50 publicly listed fintech companies with (mostly) market values in excess of $1 billion. We assign each company to a cohort, based on their categorical business model. We do this in order to understand business model variation within our analysis. Now let’s examine the results of our analysis.
What Does The Data Tells Us?
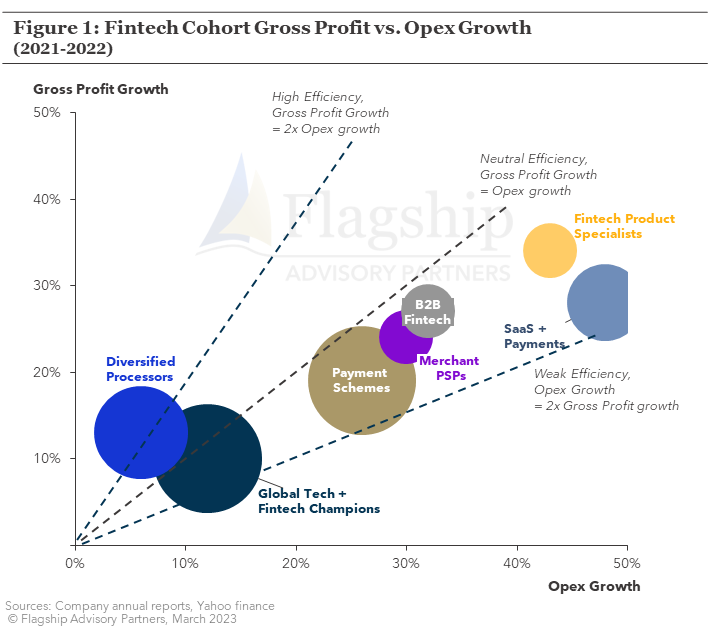
Fintech, particularly payments, is supposed to be a business model with natural economies of scale; revenue growth (or gross profit) should outpace operating expense growth. In Figure 1, our Diversified Processors cohort illustrates this principle well. This cohort generated 13% gross profit growth (8% gross rev. growth) vs. 6% opex growth between 2021 and 2022. Achieving gross profit growth at 2X opex growth generates powerful operating leverage that accelerates bottom line performance; our Diversified Processor cohort achieved a weighted-average operating income growth of 32% from ’21 to ’22 (likely benefiting somewhat from the bounce-back from the pandemic).
Interestingly, none of our other cohorts produced positive operating efficiency in the aggregate between 2021 and 2022; all other cohorts saw deteriorating expense efficiency on a weighted average basis. Peeling back the onion on our cohorts, we see idiosyncratic results that dragged on some of our cohorts:
- Merchant PSPs: Shift4, Tyro, and dLocal all delivered operating efficiency improvements between 2021 and 2022, while Adyen, Nuvei, and Flywire did not (gross profit growth < opex growth).
- Payment Schemes: Mastercard delivered efficiency improvements, but Visa, Amex, and PayPal did not.
- B2B Fintech: WEX and Avid Exchange delivered efficiency improvements, Bill.com was effectively flat, and others delivered expense efficiency declines.
- Global Tech + Fintech: most of the cohort (e.g., Uber, Sea, StoneCo) delivered efficiency improvement, but the group was dragged down by Tencent and Alibaba, resulting in efficiency decline on a weighted average basis.
The clear conclusion here is that many high-growth fintechs simply lost their way on expense management, believing that growth investment was the singular imperative heading into 2022. Such companies face a different set of expectations in 2023.

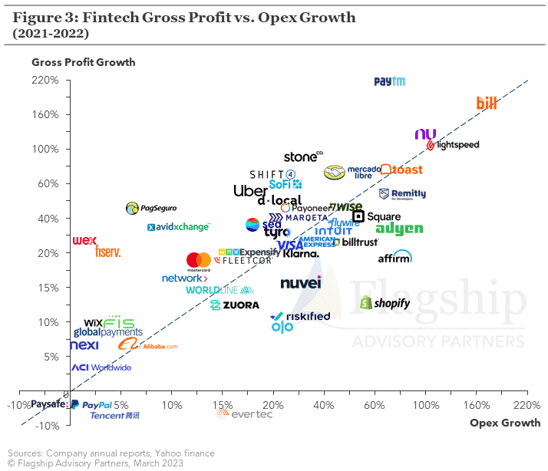
We believe that our categorical analysis tells an important story, but we also recognize that many company specific circumstances drove the results shown in Figure 3. For example, below we list a number of specific case studies where the individual company story is more nuanced than the category performance:
The Good (select examples):
- Nexi – Nexi posted a solid 7% growth in revenue/gross profit from 2021 to 2022. But this topline growth combined with a tidy 1% growth in opex to result in an impressive 14% EBITDA growth from ’21 to ’22.
- Sea Limited – Sea came under significant shareholder pressure during 2022, with its share price dropping 77% from $223.31 to $52.03. As with many e-commerce centric fintechs, Sea suffered from a rapid slowdown in growth as its market emerged from the pandemic. Sea appears to have adapted quickly however, with positive surprises for shareholders on efficiency gains in 2H 2022 (Fiscal YoY, SE delivered 33% gross profit growth vs. 22% opex growth).
- Various: 13 companies in our total sample (50) delivered a Gross Profit Growth / Opex Growth ratio greater than 2
- Adyen: In its H2 release, Adyen posted 30% gross profit growth (HoH), but only 4% operating income growth. Shareholders understandably reacted negatively to the significant drop in efficiency. On the other hand, Adyen still delivered a robust 52% EBITDA margin in 2H ‘22. Management described a need to invest into future-proofing its people and technology, which is not unreasonable, so long as efficiency gains return.
- Block (Square) – Block’s top-line and efficiency suffered somewhat from the crash of the Crypto market in 2022 relative to 2021. Gross profit from crypto declined (28%) (noting that portion of total gross profit from crypto is small). Despite crypto’s decline, Block posted good gross profit growth of 36%, however opex increased at 55% from ’21 to ’22, leading to an erosion of Block’s EBITDA performance.
- Various: 4 companies in our total sample (50) delivered an Opex Growth / Gross Profit Growth ratio between 1.5 and 2.0
The Ugly:
- Various: 3 companies in our total sample (50) delivered negative gross profit growth and 7 companies in our total sample delivered an Opex Growth / Gross Profit Growth ratio greater than 2.0.
People Costs Matter

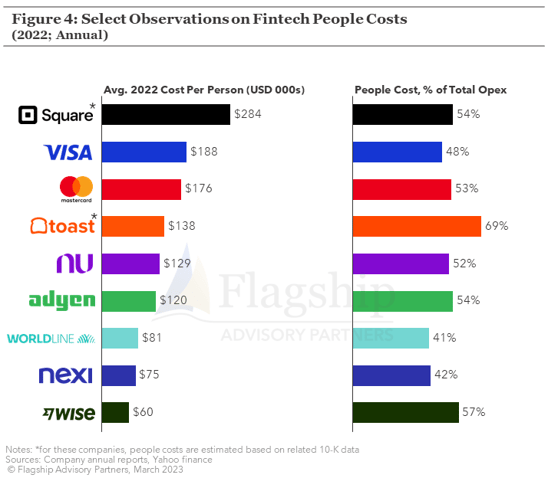
People costs are often the largest category of expense for fintechs. As shown in Figure 4, among a smaller subset of our fintech sample, people costs ranged from 41% to 69%. Virtually all of the companies in our people-cost-sample (subset of the 50 companies) continued to grow their teams during 2022, although overall operating costs generally grew at a faster rate than headcount. Several of our total sample companies already announced plans for workforce reductions in 2023.
We also examined the average cost per person, which reveals a sharp contrast between the high-cost of U.S. high-growth fintechs vs. European and global peers. As shown in Figure 3, Square tops out sample with an average person cost of $284k in 2022. This compares to avg. person costs of only €71k at Nexi ($75k in USD) or an est. £50K at Wise ($60k in USD). The high cost of U.S. people is a major reason why many U.S. high-growth fintechs (e.g., Stripe, Shopify) are still striving for positive EBITDA results.
U.S. fintech companies in particular should be focused on establishing substantive offshoring or nearshoring operations as an operating model where a vast-majority of people are paid at U.S. compensation levels appears to be a challenging hurdle for delivering strong profitability. Recent news on Stripe seems to indicate this challenge.
Conclusions
2022 produced a reversal of fortune of sorts in fintech. High-growth fintechs focused on digital commerce and embedded finance, the darlings of pandemic investing, experienced surprising pressure on top-line growth. These same companies correspondingly delivered disappointing EBITDA performance in 2022, driven by opex growth outpacing gross profit growth, sometimes by orders of magnitude. These high-growth fintechs must now adapt to investor sentiment more-focused on bottom-line performance. In stark contrast, many mature fintechs such as diversified processors, delivered excellent bottom-line performance in 2022, propelled by strong scale/expense efficiencies.
Please do not hesitate to contact Joel Van Arsdale at Joel@FlagshipAP.com with comments or questions.


